Connectivity status in Local Government Institutions as on 31 Jan 2012.
State wide status
| Sl No | LB Type | LBs | Connectivity Established | Percentage Covered | ||
| KSWAN | VPN | Total | ||||
| 1 | Municipal Coporations | 5 | 3 | 2 | 5 | 100.00 |
| 2 | Municipalities | 60 | 33 | 20 | 53 | 88.33 |
| 3 | District Panchayats | 14 | 14 | 0 | 14 | 100.00 |
| 4 | Block Panchayats | 152 | 140 | 0 | 140 | 92.11 |
| 5 | Grama Panchayats | 978 | 70 | 789 | 859 | 87.83 |
| Grand Total | 1209 | 260 | 809 | 1071 | 88.59 | |
District wise Connectivity status
| Sl No | District | LBs | Connectivity Established | To be Established | Percentage Covered | ||
| KSWAN | LGWAN | Total | |||||
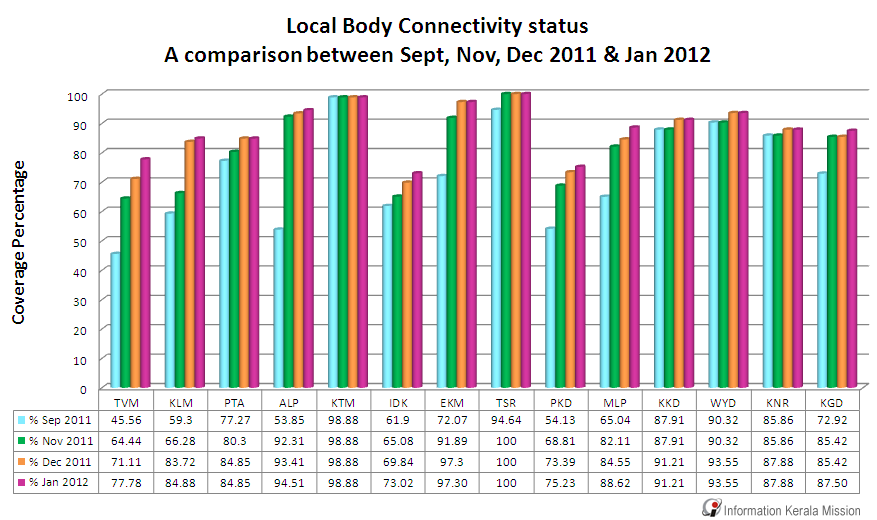
| 1 | Thiruvananthapuram | 90 | 25 | 45 | 70 | 20 | 77.78 |
| 2 | Kollam | 86 | 12 | 61 | 73 | 13 | 84.88 |
| 3 | Pathanamthitta | 66 | 14 | 42 | 56 | 10 | 84.85 |
| 4 | Alappuzha | 91 | 21 | 65 | 86 | 5 | 94.51 |
| 5 | Kottayam | 89 | 20 | 68 | 88 | 1 | 98.88 |
| 6 | Idukki | 63 | 15 | 31 | 46 | 17 | 73.02 |
| 7 | Ernakulam | 111 | 20 | 88 | 108 | 3 | 97.30 |
| 8 | Thrissur | 112 | 29 | 83 | 112 | 0 | 100.00 |
| 9 | Palakkad | 109 | 32 | 50 | 82 | 27 | 75.23 |
| 10 | Malappuram | 123 | 25 | 84 | 109 | 14 | 88.62 |
| 11 | Kozhikode | 91 | 14 | 69 | 83 | 8 | 91.21 |
| 12 | Wayanad | 31 | 5 | 24 | 29 | 2 | 93.55 |
| 13 | Kannur | 99 | 15 | 72 | 87 | 12 | 87.88 |
| 14 | Kasaragod | 48 | 13 | 29 | 42 | 6 | 87.50 |
| Grand Total | 1209 | 260 | 811 | 1071 | 138 | 88.59 | |
A Comparison with previous month
| Period (Month & year) | No. of LBs | LBs Connected | Coverage Percentage | Percentage of Increment |
| Sep-2011 | 1209 | 872 | 72.13 | |
| Nov-2011 | 1209 | 1005 | 83.13 | 11.00 |
| Dec-2011 | 1209 | 1053 | 87.10 | 3.97 |
| Jan-2012 | 1209 | 1071 | 88.59 | 1.49 |